Step 4: Choosing the temperature program
The two main aspects that have to be considered are the
- Type of temperature program (single segment, multi-segment, modulated temperature program).
- Choice of parameters (heating rate, start and end temperatures, and if relevant, amplitude and period).

The heating rate and the start and end temperatures are chosen with the following factors in mind:
- Thermal conductivity of the sample: the temperature distribution in the sample should always be as homogeneous as possible (-> low heating rates).
- The lower the heating rate, the better the temperature resolution.
- The higher the heating rate, the more pronounced the effects (DSC, SDTA).
- Start and end temperatures: the time interval before and after the first and last thermal events should be sufficiently long to enable a clear “baseline” to be drawn. Recommended values: DSC 3 min, TGA: 5 min, TMA: 5 min, DMA 8 min.
Step 5: Choosing the atmosphere
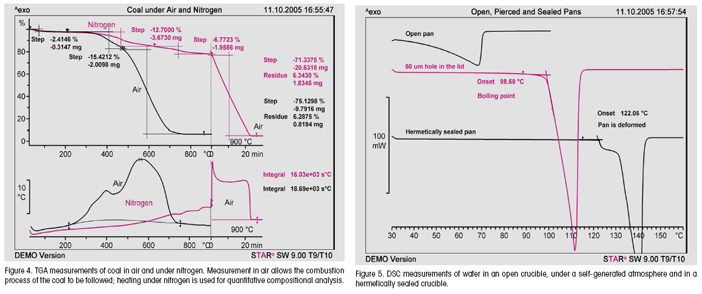
With DSC and TGA in particular, different atmospheric conditions allow different types of information to be obtained. This is illustrated in Figure 4, which describes the decomposition of coal as an example. The upper curve was measured in an air atmosphere, the lower curve under nitrogen (up to 900 °C) and then air (above 900 °C). In air, the combustion profile of the sample is of interest, that is, the temperature at which the coal begins to burn, and how the combustion process proceeds. If the measurement is first performed in an inert atmosphere and then finally under air, the main questions have to do with the composition of the coal, that is, the content of volatile compounds (moisture, adsorbed gases), whether inorganic compounds are present, and the carbon content.
In DSC, the atmosphere within the crucible plays an important role. For example, in an open crucible, one observes the slow evaporation of solvents and moisture. This process gives rise to broad endothermic peaks that sometimes overlap with other interesting effects such as glass transitions and polymorphic transitions.
If the crucible is sealed with a crucible lid that has been pierced with a small hole, a so-called self-generated atmosphere is created and the evaporation process is delayed almost to the boiling point of the liquid. Above the boiling point, the liquid evaporates rapidly from the crucible. METTLER TOLEDO supplies lids with a hole-diameter of 50 μm for this type of measurement. Finally, in a hermetically sealed crucible, the boiling point can be exceeded. The crucible is then under pressure. This can lead to initial deformation of the crucible and ultimately, on further temperature increase, to bursting (see Figure 5). Endothermic evaporation can be completely suppressed by using medium pressure crucibles.

Step 6: Examining the sample after measurement
One should make a habit of weighing samples before and after an experiment (even with TMA and DMA measurements). Small mass changes indicate that evaporation or initial decomposition processes have taken place. This usually has an effect on the measurement curves (not only DSC, but also TMA and DMA curves). These effects are often only weak and may hardly be noticeable so that the gravimetric information is very important.
A further aid to interpretation is a visual examination of the sample after the experiment. Points to check are
- Has the color changed?
- Does the sample appear to have melted?
- Has the sample undergone deformation?
Step 7: Evaluation
To obtain quantitative results, the measured curves have to be properly evaluated. Often, several different methods (involving the choice of baseline, drawing of tangents, etc) are available to calculate numerical results from the curves. This in turn may lead to different measurement results being obtained. For example, the glass transition temperature can be determined from DSC curves according to ASTM and DIN methods, and according to other procedures (Richardson, bisector of tangents). To meaningfully compare measurement results, it is important to evaluate measurement curves in exactly the same way each time and to state the method used (baseline type, tangent type) to obtain the results.
Step 8: Validation
Once steps 1 to 7 have been defined, the final task is to design an experimental plan for validation, that is, to plan a certain number of experiments. This includes specifying the number of repeat measurements (for repeatability) that must be performed, as well as defining the order in which sample and reference sample measurements and blank curves must be measured. This also includes giving details about the statistical methods to be used for further analysis of experimental series.
Conclusions
Method development begins with a trial method that is optimized in steps and finally validated. A good trial method can greatly facilitate the method development and validation processes that follow. Table 5 summarizes the most important points that should be considered in method development.
 | New Thermal Analysis Excellence Its fast and easy to see why the best instrument signals at every level are only possible with our versatile, customizable and upgradeable platform. With a short set of questions you can build your solution. Select an Instrument Below to Get Started: |
 |  |
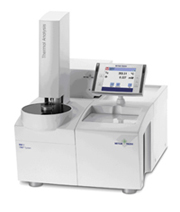
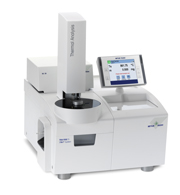
| DSC 1 | TGA/DSC 1 |
| Differential Scanning Calorimetry (DSC) allows you to determine the energy absorbed or released by a sample as it is heated, cooled or held at constant temperature. | Thermogravimetric Analysis (TGA) measures the mass of a sample as it is heated, cooled or held at constant temperature in a defined atmosphere. |
| Customize a DSC 1 | Customize a TGA/DSC 1 |